Data Visualization Tool
Transform
CSV files into
Dashboards
Convert complex spreadsheet data into intuitive charts and insights in seconds. No coding, no installation.
6+
Chart Types
0
No Install
100%
Free

Simple Upload
Start Instantly
with Drag & Drop
Drag or click to upload your CSV file. Data is processed only in your browser for complete privacy.
CSV Support
Compatible with all CSV formats
Instant Analysis
Charts generated on upload
Drag your CSV file here
or click to select a file
Features
The Fastest Way
to Understand Data
Get instant insights from CSV data without professional analysis tools.
6 Chart Types
Automatically recommends and generates bar, line, pie, donut, area, and scatter charts.
Auto Data Analysis
Automatically detects column types and recommends optimal visualization.
Multiple Exports
Export dashboards as PNG, PDF, or Excel for reports and presentations.
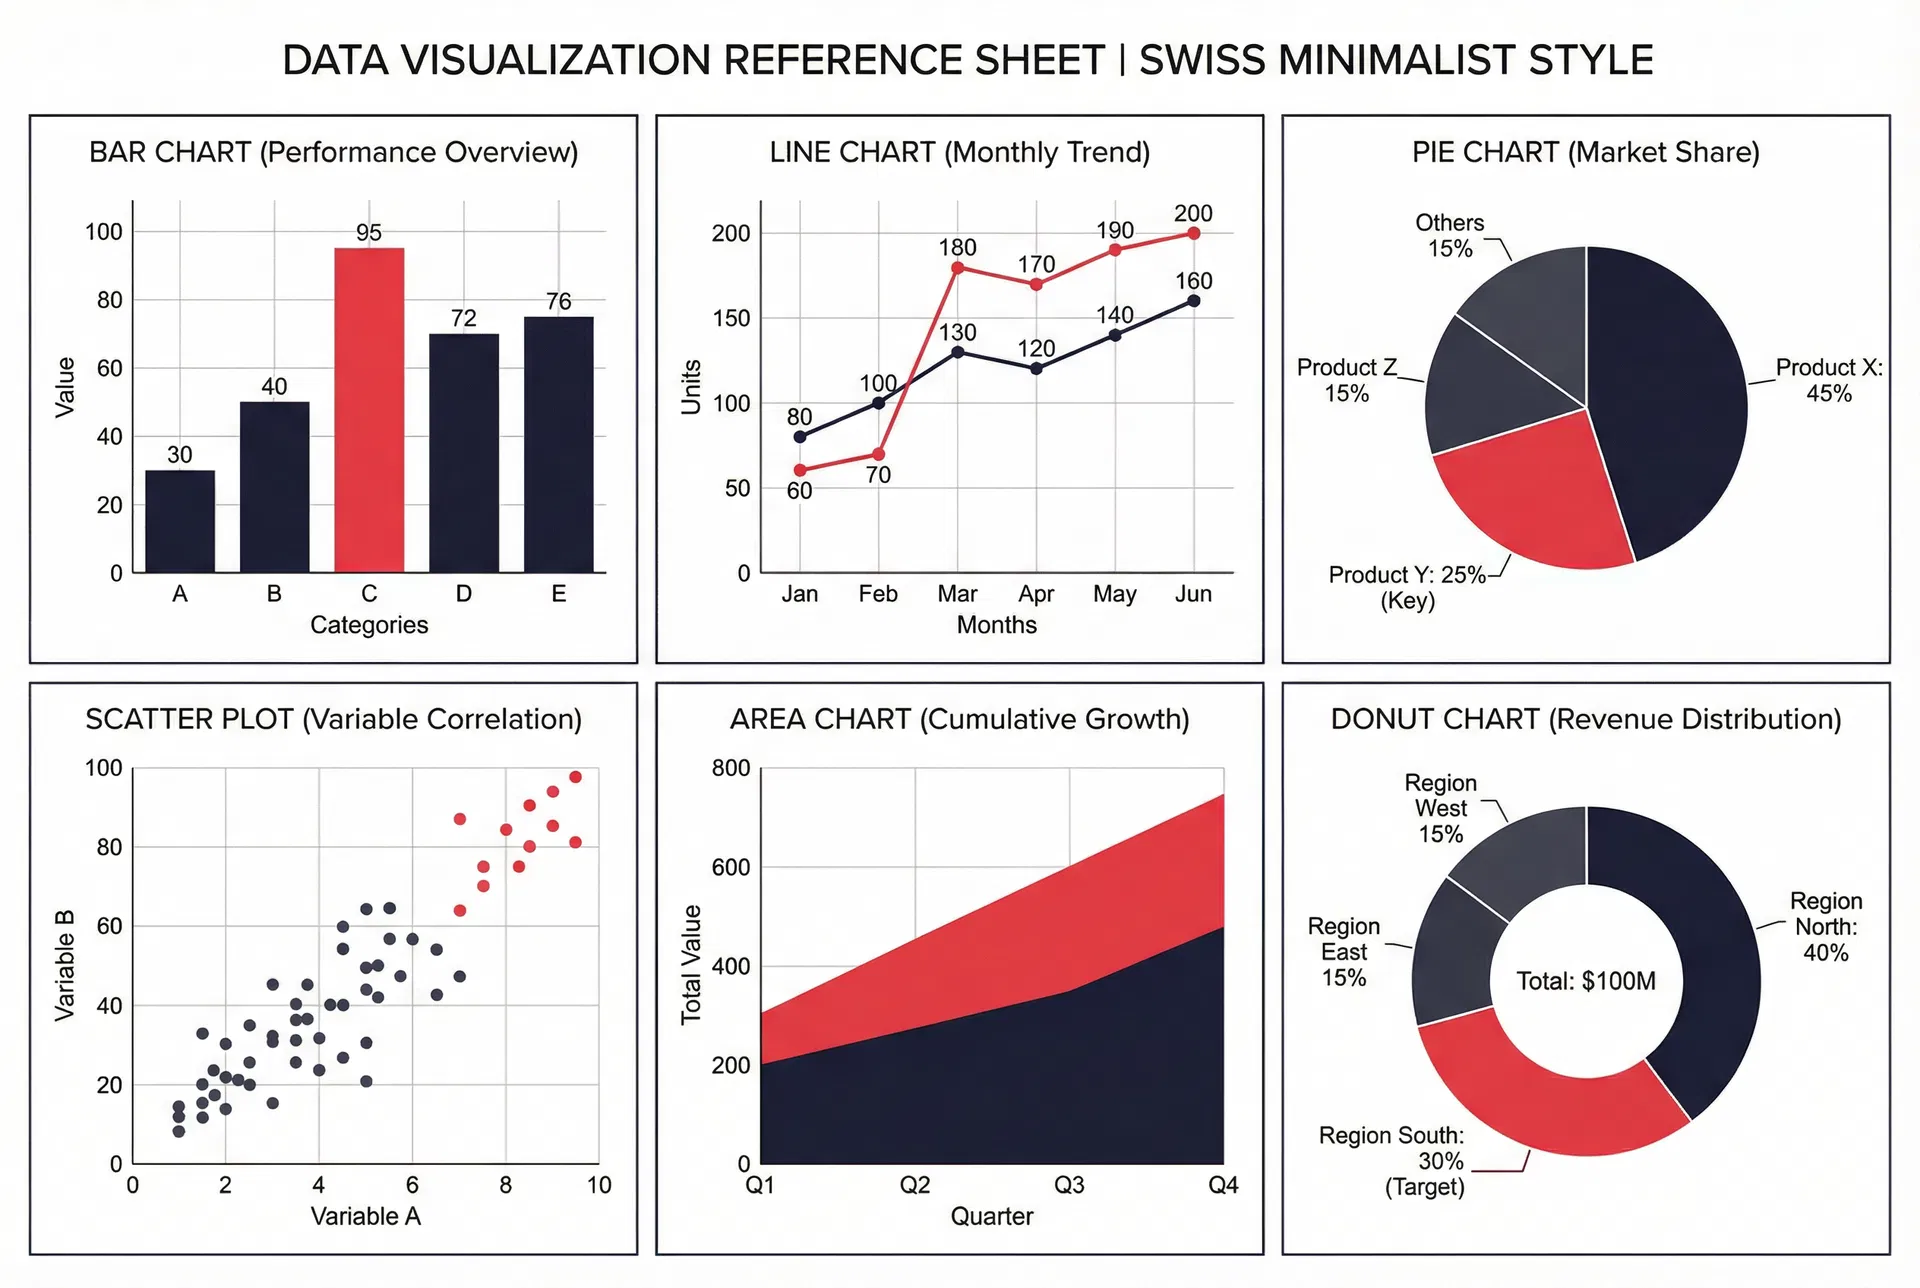
Chart Types
Express Data
with Various Charts
Automatically recommends the best chart type based on your data characteristics.
Get Started Now
All you need is a CSV file. No sign-up, no installation required.